There have been many posts online about generating networkx and matplotlib graphs, however I ran into troubles where my graphs didn't quite agree well with default layouts that networkx provides. Here are some examples:
 |  |
| Spring layout | Spectral layout |
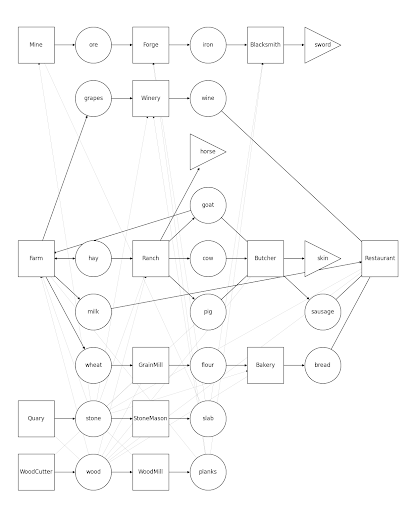
I've tried them all but in many cases node data was hard to read and links were either too large or too small. I'm working on a crafting system for a game, and want to be able to visualize recipes and item progression through the game. I want to detect useless items, or uncraftable items, as well as a system to help me balance the item crafting with the passage of time. My graph is a DiGraph that has two kinds of nodes - buildings that contain recipes, and items that can go through a building to change its form. E.g. ore -> Forge -> iron. In addition, buildings take items to be built - so there are two kinds of paths - recipe path, and construction path. Since most buildings are built from some sort of wood/stone combo there are many construction paths coming out of wood and stone. That is partially why both spring and spectral layouts tend to be clustered around wood and stone - those are the most connected nodes. Dropping those links doesn't help at all:
 |  |
| Spring layout | Spectral layout |
So I started making my own layout. Networkx's layout generators are relatively straight-forward in their API - given a graph, output a dictionary that maps nodes to their positions. Mapping all of the nodes to (0,0) for example can be done with:
Where G is the Graph. Since I want to show a clear relationship between nodes connecting to each other I decided to calculate nodes' position based on paths from one node to another. I tend to read left-to-right so I wanted to lay the recipes out left-to-right. We start with some source nodes - nodes that don't have any links coming to them - those are also going to be building nodes - and place them on the left most of the graph. Then we trace the connections, following only the recipe connections (not the construction ones). Each time we visit a child, we put it right of the parent, unless the spot is already taken, then we put it right, above the parent. Repeat until we are able to place all of the children. Let's convert this paragraph to code!
First, we start with some source nodes. Networkx lets you to check that with
However, remember that our buildings also take construction materials. So wood and stone would be a predecessor to all of the buildings. In my particular case I can just filter nodes that aren't buildingds, but for general case we can solve this by passing a lambda for ignoring non-source nodes while placing objects:
You will likely want to change the way you check edge data, but that's my graph's data structure. From here we're ready to start placing nodes. We will need to keep track of the span for node's children, as well as an ability to move child nodes a bit up for a better alignment. We can achieve it using a doubly nested dictionary, but I created a helper class to simplify syntax a little bit and provide default values:
This makes grid to be referenced by a single square braket pair and will never complain about missing keys this allows us to quickly find an empty cell:
So lets review the way we want to generate this layout:
- We start at the most left and place a source node there.
- For each child of the node we place them to the right.
- Ideally we recenter parent node so that parent is aligned with the center of its children nodes
- Repeat (2.) until we don't have any more children
- Repeat (1.) until we don't have any more unvisited source nodes.
The unvisited is one of the keys there, but it will depend on how you define your source node lambda. If you use DiGraph and the G.predecessors(node) check, trace will never be able to reach those nodes since they don't have anything that can reach them, but if you use a regular Graph that won't work, so I included the visited set check to make sure we don't have infinite loops. This check also helps if you have cycles in your recipes.Let's put the whole function together:
And the result we get is:


No comments:
Post a Comment